Margate Coastal Park

Analytical Maps
The maps in this section are thematically analytical, with the following themes:
- Landmarks
- Open Spaces
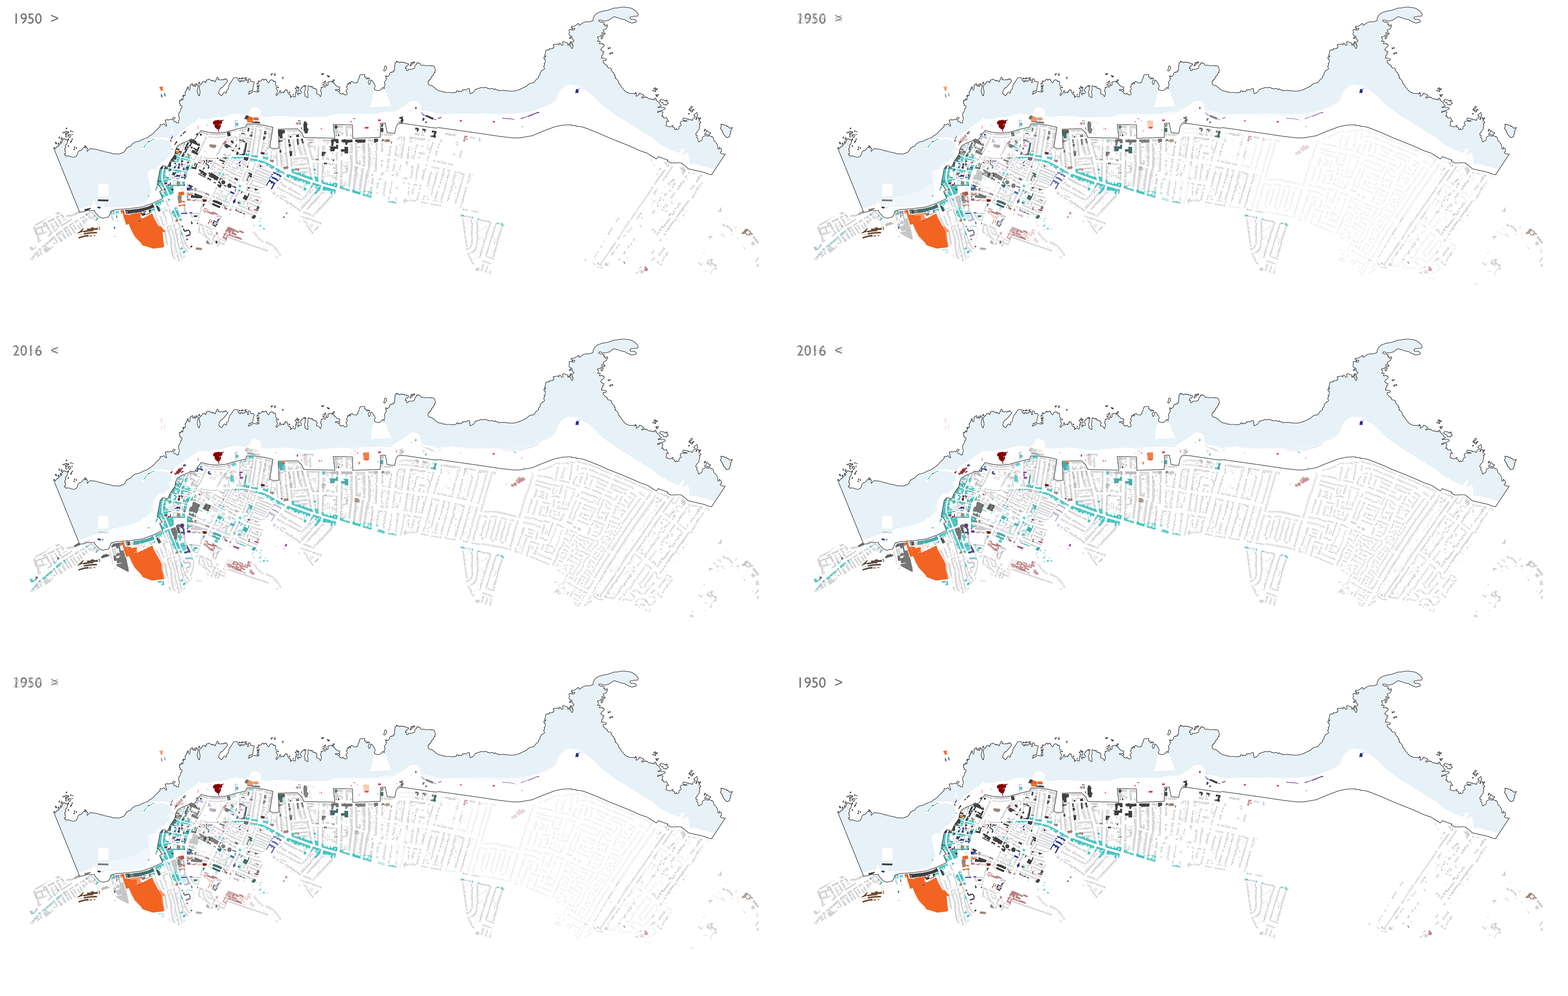
- Building Uses (shown above as a Gif)
- Circulation
Each theme has two maps - one from the 1950s and one from 2013, with the exception of the Landmark map where development and change over time are simply represented in different colours.
The aim of these maps is to be able to compare change over the past 60 years, across the critical period of what may be called the post-war decline of the British Seaside. We are able to see from this analysis how the architecture, urban form and public realm of the area has changed in response to dramatic changes in society and ‘use’ of the town.
We cannot claim that the maps are completely accurate - they are presented more as a work in progress, a methodology for capturing and representing a type of change, rather than currently 100% accurate. They are intended as a tool for sharing, updating and understanding. It is the nature of time and change that the map intended to show a current situation will be out-dated in a very short time. We envisage that these maps will be most useful in a more interactive form, whereby many users can access and update the maps in the way that Wikipedia can be updated, or information added to a Google map.
The whole section can be downloaded by clicking on the cloud icon below.


